Dear Readers:
We are making a transition over to WordPress.
Since, there are over 600 post on this site. We tried to export to WordPress, the transfer from Google to WordPress was less than desired. So we will be leaving this site up, and providing a link back here. So you may see and review past articles we have written on this site, but as far as the new stuff it will be over at http://milioncapital.wordpress.com/
Come and check it out.
Saturday, May 12, 2012
Wednesday, May 9, 2012
Morning's Option Watch List - May 9, 2012 (Results)
NYSE
CF - CF Industrial Holdings - 185 May 19exp Call - Open: $1.28 to $1.26 Day H: $2.38 / Day Low: $1.15
LNKD - LinkedIn - 120 May 19exp Call - Open: $1.40 to $2.00 - Day High: $2.70 / Day Low: $1.15
NASDAQ
AAPL - Apple Inc. - 575 May 19exp Call - Open: $6.20 to $7.60 - Day High: $10.20 / Day Low: $5.50
AMZN - Amazon.com Inc. - 230 May 19exp Call - Open: 1.31 to 1.90 - Day High: $2.92 / Day Low: $1.27
Sunday, May 6, 2012
Notable Weekly Option With Earnings Due Monday - Friday
DNDN - Dendreon Corp. - Biotechnology
HL - Hecla Mining Co. - Silver
PCX - Patriot Coal Corporation - Industrial Metals & Minerals
YOKU - Yoku, Inc - Internet Information Providers
CSCO - Cisco Systems Inc. - Networking & Communication Devices
MCP - Molycorp, Inc. - Basic Materials
NVDA - NVIDIA Corporation - Semiconductor- Specialized
HL - Hecla Mining Co. - Silver
PCX - Patriot Coal Corporation - Industrial Metals & Minerals
YOKU - Yoku, Inc - Internet Information Providers
CSCO - Cisco Systems Inc. - Networking & Communication Devices
MCP - Molycorp, Inc. - Basic Materials
NVDA - NVIDIA Corporation - Semiconductor- Specialized
Notable Weekly Option Preview for Monday 7, 2012
LNKD - LinkedIn Corporation - Internet Information Providers
AIG - American International Group, Inc - Property & Casualty Insurance
APA - Apache Corp - Independent Oil & Gas
V - Visa, Inc. - Business Services

AIG - American International Group, Inc - Property & Casualty Insurance
APA - Apache Corp - Independent Oil & Gas
V - Visa, Inc. - Business Services


Thursday, May 3, 2012

Tuesday, May 1, 2012
Notable Option Preview for Tuesday May 2, 2012
ANF - Abercrombie & Fitch Co. - Apparel Stores
DVN - Devon Energy Corporation - Independent Oil & Gas
DE - Deere & Company - Farm & Construction Machinery
DVN - Devon Energy Corporation - Independent Oil & Gas
DE - Deere & Company - Farm & Construction Machinery
 |
| Charts provided by Finviz.com |
Friday, April 27, 2012
Notable Weekly Option Preview for Monday's open:
NASDAQ
$PCLN 752 $CALL
$AMZN 225 $CALL
$AAPL 605 $PUT
$GOOG 617 $PUT
NYSE
$LNKD 105 $CALL
$CF 195 $ CALL
$PCLN 752 $CALL
$AMZN 225 $CALL
$AAPL 605 $PUT
$GOOG 617 $PUT
NYSE
$LNKD 105 $CALL
$CF 195 $ CALL
Sunday, April 22, 2012

Notable Weekly Option Preview for Monday 4/23/2012
DE - Deere & Company - Farm & Construction Machinery
SLB - Schlumberger Limited - Oil & Gas Equipment & Services
WLT - Walter Energy, Inc. Industrial Metals & Minerals

SLB - Schlumberger Limited - Oil & Gas Equipment & Services
WLT - Walter Energy, Inc. Industrial Metals & Minerals
 |
| Charts provided by Finviz.com |

Tuesday, April 17, 2012
Notable Weekly Option Preview for Wednesday 4/18/2012
DE - Deere & Company - Farm & Construction Machinery
CLF - Cliffs Natural Resources Inc. - Steel & Iron
WLT - Walter Energy, Inc. - Industrial Metals & Minerals
LVS - Las Vegas Sands Corp. - Resorts & Casinos
LULU - Luluemon Athletica Inc. - Textile - Apparel Clothing
CLF - Cliffs Natural Resources Inc. - Steel & Iron
WLT - Walter Energy, Inc. - Industrial Metals & Minerals
LVS - Las Vegas Sands Corp. - Resorts & Casinos
LULU - Luluemon Athletica Inc. - Textile - Apparel Clothing
 |
| Charts provided by Finviz.com |
Thursday, April 12, 2012
Notable Weekly Option Preview for Friday 4/13/2012
WLT - Walter Energy, Inc - Industrial Metals & Minerals
CLF - Cliffs Natural Resources, Inc - Steel & Iron
LVS - Las Vegas Sands Corp - Resorts & Casinos
BBBY - Bed Bath & Beyond, Inc - Home Furnishing Stores
CLF - Cliffs Natural Resources, Inc - Steel & Iron
LVS - Las Vegas Sands Corp - Resorts & Casinos
BBBY - Bed Bath & Beyond, Inc - Home Furnishing Stores
 |
| Charts Provided By Finviz.com |
Tuesday, April 10, 2012
Notable Weekly Option Preview for Wednesday 4/11/2012
LVS - Las Vegas Sands Corp. - Resorts & Casinos
BBBY - Bed Bath & Beyond Inc - Home Furnishing Stores
BBBY - Bed Bath & Beyond Inc - Home Furnishing Stores
 |
| Charts provided by www.Finviz.com |
Monday, April 9, 2012
Notable Weekly Option Preview for Tuesday 4/10/2012
LVS - Las Vegas Sands Corp. - Resorts & Casinos
BBBY - Bed Bath & Beyond Inc - Home Furnishing Stores
LULU - Lululemon Athletica Inc. Textile - Apparel Clothing
BBBY - Bed Bath & Beyond Inc - Home Furnishing Stores
LULU - Lululemon Athletica Inc. Textile - Apparel Clothing
 |
| Charts provided by Finviz |
Friday, April 6, 2012

Notable Weekly Option Preview for Monday Apr 9
CAT - Caterpillar Inc - Conglomerates
CRM - Application Software
CF - Agricultural Chemicals
LVS - Las Vegas Sands Corp.
Notable Weekly High-Flyers
AAPL - Apple Inc. - Personal Computers
BBBY - Bed Bath & Beyond Inc - Home Furnishing Stores
LULU - Luluemon Athletica Inc - Textitle - Apparel Clothing
CRM - Application Software
CF - Agricultural Chemicals
LVS - Las Vegas Sands Corp.
 | |
| Charts provided by Finviz.com |
Notable Weekly High-Flyers
AAPL - Apple Inc. - Personal Computers
BBBY - Bed Bath & Beyond Inc - Home Furnishing Stores
LULU - Luluemon Athletica Inc - Textitle - Apparel Clothing
 |
Charts provided by Finviz.com |
Monday, April 2, 2012
Sunday, April 1, 2012

Saturday, March 31, 2012
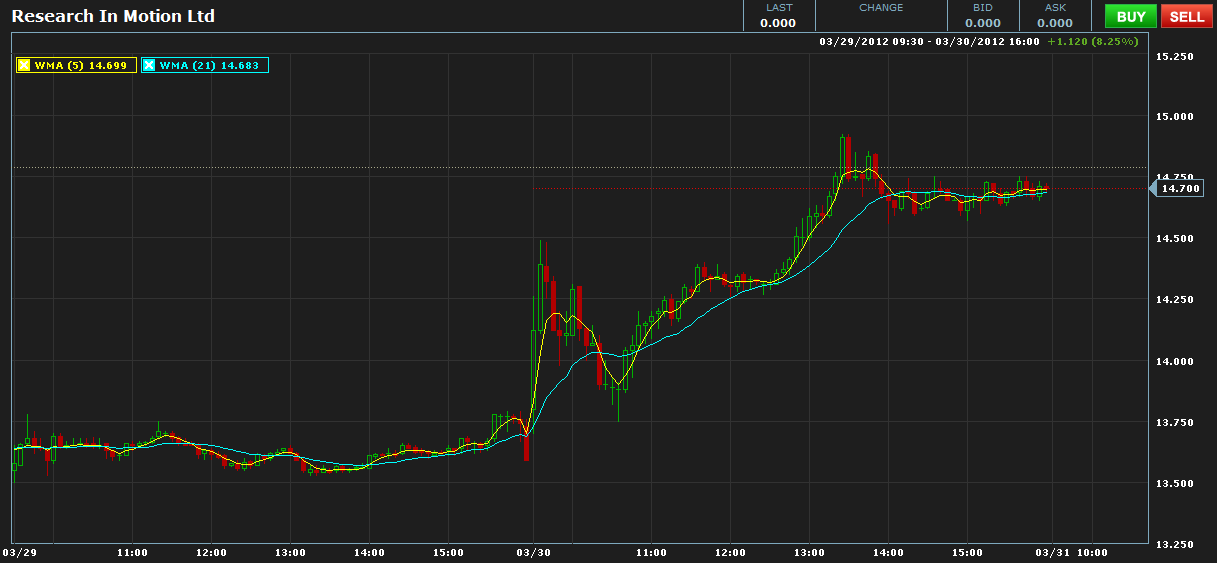
RIMM Shot - 14c Apr
 |
| Stock Chart Provided by OptionsXpress |
 | |
| Option Chart Provided by OptionsXpress |
 |
| Option Provided by QuoteMedia |
RIMM cleaned house after missing FQ4 estimates, discontinuing guidance, and announcing major executive departures.The rumor started again, "Finally, if reluctantly, admitted it might consider a sale of the company, WSJ's Deal Journal plays matchmaker, trying to suss out which of the many companies rumored to be eyeing RIM might actually make a move for the ailing smartphone maker."
This where the RIMM 14c Apr came into play. One of the members in the SangLucci Weekly Option room, we talked about if RIMM was able to hold $13.80 per share if could see $14.50 at least for the intra-day trading. Wild card is if you wanted a "Lotto Play" then RIMM 14c Mar Qtr would have done the trick.
 |
| Option Provided by QuoteMedia |
Thursday, March 29, 2012


CAT - Lotto Play


Big CAT was a bear yesterday and CAT fight was on. Today regain much of it back .39 open to 1.50 to close.
Sunday, March 25, 2012

Wednesday, March 21, 2012


Sunday, March 18, 2012

Saturday, March 17, 2012
AMZN - LottoPlay


Friday started out as a pretty quite day in AMZN, as you can see on the 5 min chart. By 12:25PM ET was an interesting play in the AMZN 185c March option. Most of the time they pin and sideways trade until the premium, but stock has a subdued premarket with no intention of letting the retail investor profit from Friday's OpEx. AMZN Bid/ASK at the 12:25PM ET was .11 x .14, which pretty high based on the opening of .01 x .05, you could have lost it all to the sideways trade action that is involved on Friday, if you had full size contracts.
By No Means this is a viable trade every Friday, but a lottoPlay Logic told us that the market was going to flat-line. Chart told us maybe a chance.
NKE - Earnings Release 3/22/2012 @ 4:15PM
Here’s the chart for Yoku via Finviz:


Earnings Play:
NIKE, Inc. (NIKE), is engaged in design, development and marketing of footwear, apparel, equipment and accessory products. NIKE is a seller of athletic footwear and athletic apparel in the world.
Optionable
Would not hold on Earnings Release Date.
3rd Qtr Ending February 2012 – Release Date 3/22/2012 @ 4:15PM ET
Street value $1.21 vs $1.16.
Looking for a Beat of $0.05 or In-line EPS
Production Line: Nike (NKE) unveils several new high-end products, with the goal of showcasing them at the 2012 Summer Olympics. Perhaps the most important of the bunch is Nike's Flyknit running shoe. The result of 4 years of R&D work and proprietary manufacturing processes, Nike boasts the Flyknit offers the fit and comfort of a sock, while maintaining the structure and durability of a shoe. Nike's (NKE) new Flyknit shoes will prove good for runners and maybe great for investors, analysts say. Nike is using "micro-level precision engineering," where changes can be made nearly on the fly to account for new demands, and the process is so efficient NKE might be able to move production out of Asia and eventually make customized shoes per individual specifications.
The newest Nike (NKE) "monster" innovation: the Nike+ Fuelband, a wristband meant to monitor your movements; the user inputs the information on the web, and the bracelet lets him know when he hits fitness goals for each day. Some analyst thinks it's seen as a game-changer, calling the device the "iPod of fitness.". The firm's Nike+ FuelBand is a wristband that tracks everyday movements and provides metrics fort users to sync to smartphone devices or view online A new product aimed at motivating users to stay more active.
The arrival of Nike's new Air Jordan 11 Retro Concords creates massive lines in stores across the county, as well as some unfortunate breakouts of violence over the iconic sneakers priced at $180. Industry analysts estimate 300K-500K pairs have been produced by Nike in a campaign light on marketing.
Prior Earnings Release: FQ2 EPS of $1.00 beats by $0.03. Revenue of $5.73B (+18% Y/Y) beats by $100M. Shares +0.8% AH. Charles Denson says in an earnings CC that the running craze of the 1970s - to which the company can trace its ascent to a publicly trading company from a regional shoe seller - is back in full force. "We haven't seen this much energy around Running since the first boom happened back in the '70s. We were in the middle of that one, and we're in the middle of this one as well. Our results prove it, with Running up strong double digits again in Q2."
Analysts Comments: Analysts are jumping on the bandwagon with the notion that the Nike+ Fuelband could be a serious revenue driver for the company. D.A. Davidson starts coverage with a Buy, on a belief its track record and growth potential justify a premium valuation. Citigroup says it anticipates more upside despite the stock's recent rally, and raises its price target to $123 from $115. Citi notes the sports apparel giant could report futures up 16% - 17% on March 22 due to higher prices in its retail line, the NFL license and momentum in footwear. Argus takes a shine to Nike (NKE), boosting its rating to Buy from Hold with a lofty price target of $118 on shares. Morgan is launching coverage on Nike with an Equal-Weight.
Competitors: The bad times get worse for K-Swiss, after the shoemaker's Q4 miss and soft 2012 revenue guidance ($240M-$250M vs. consensus of $269.8M) demonstrate the challenges it faces in competing with larger rivals Nike (NKE) and Adidas (ADDYY.PK). K-Swiss' Q4 gross margin was just 25.6%, down 680 bps Y/Y and well below Nike's FQ2 gross margin of 42.7%.
Real Estate development: Nike (NKE) announces plans for the development of a new centralized campus in Shanghai, China. The nearly 600K square foot headquarters will be built at The Springs, Tishman Speyer's newest mixed-use development in Shanghai's Yangpu District. Nike (NKE) does its part in Athens, leasing 8.3K sq. ft. of prime rental space for at least 43% less than the previous tenant. Greek retail sales have been diving for months - 8.1% Y/Y at the latest read - and the space has been vacant for nearly 2 years. Nike's landlord is the Greek civil servants pension fund.
Tuesday, March 13, 2012


Sunday, March 11, 2012
New Weekly Option - Watch List

Click on image to enlarge.
Here’s the charts via Finviz:

LULU is scheduled for earnings, I would be exit before the release and re-asses the stock after the release.

Thursday, March 8, 2012
LULU - Strangle Pre - Earnings Run
Looking at the LULU strangle:
2012 Apr 21 70.00 Call for lululemon athletica inc.
2012 Apr 21 72.50 Put for lululemon athletica inc.
Here’s the chart for Lulu via Finviz:


2012 Apr 21 70.00 Call for lululemon athletica inc.
2012 Apr 21 72.50 Put for lululemon athletica inc.
Here’s the chart for Lulu via Finviz:


YOKU - EARNINGS UPDATED TO MONDAY 3/12/2012
| 2012 Mar 17 25.00 Call for Youku Last Sale: $6.50 as of 3/13/2012, with Takeover announcement of another company. | |
YOKU earnings moved up to Monday 3/12/2012 from Wednesday.
UPDATED http://finance.yahoo.com/news/youku-announce-time-change-fourth-190500223.html
Looking at the 2012 Mar 17 25.00 Call for Youku - last sale $1.80.
Here’s the chart for Yoku via Finviz:

Sunday, March 4, 2012

Saturday, March 3, 2012
Options Trading In Limbo on Halted Wynn Resorts, Ltd., Stock

Options traders were in limbo as of Friday trading in shares of Wynn Resorts, Ltd., a developer, owner and operator of destination casino resorts company listed on the NASDAQ, was halted over allegations of land concession.
Friday 12:02 PM Wynn Resorts (WYNN +6%) resumes trading after this morning's shenanigans regarding its 8-K filing. Following a sharp momentary drop, the shares return to near where they were previously. Pushing the send button on the filing may have been an error, but the fact that it was prepared may mean the deal is set to go.
Friday 11:42 AM The 8-K filing by Wynn Resorts (WYNN +6.3%) saying it had an agreement with Macau for land to build another resort was a mistake and had not been authorized. "The Cotai Land Concession Contract has not been gazetted," reads the new 8-K. Shares remain halted.
Friday 11:08 AM Wynn Resorts (WYNN +6.3%) says it has accepted (8-K) the terms and conditions of the Macau government that will allow the building of a 5-star resort on the Cotai Strip. There are rumors the SEC filing was made in error. The shares remain halted from trade.
Friday 10:52 AM Wynn Resorts (WYNN +6.3%) is halted, with word about it has gotten a land concession necessary to build another resort in Macau.
Specifically, options traders who have sunk money in puts and calls (to hedge their holdings or to bet against the stock) are facing a big dilemma: Should they let potentially profitable options expire without making a profit or should they tell their brokers to act without any certainty about where the stock will again open at?
Choosing to do nothing will mean walking away from potentially extremely profitable options – especially those who own weekly options. Remember, that weekly options if not open for trading is the fastest decaying asset of all options, you will not be able to recover from. Especially, on OptionEx. They could have waited all day, to re-open WYNN. Wynn's Time-Decay would have been catastrophic on the Weekly's.
On the other hand, option traders face the dilemma that there could be a huge price swing from – the last price at which the stock traded. Any big price swing could cause havoc for any options traders who own options at the time of the halt.
Options traders are also facing the same problem with other companies that have had share halted due to halts.
Moreover, Analysts have noted that many options traders are completely unprepared should there be a halt in trading on any stock in which they are trading options on.
In conclusion
Halts are never good or predictable for the Weekly Options Trader. Never put all your dollars in one basket, as this is a high flyer and everyone wants to own it.
Check out: WYNN – Anatomy of an Erroneous Press Release http://bit.ly/wcLQI4 by kid dynamite
Opening Range Breakout - Option
We are make a simplified method which can provide a quick and dirty method, on very active stocks you can actually purchase much closer to "At-the-money" for better value because of increased volatility, but it takes additional analysis in order to do so. The closer an option is to expiration the less you will pay in premium which means that to get the best price we want to be holding an option that is at least one month away than the longest time we anticipate being in the position.
Remember, we are not going to hold till expiration anyway. Learn leverage with options for consistent income – We may sell it after ...3 minutes to 3 hours to 3 days … dollar rotation is the key as these are only short term traded options, with no appreciable loss of premium, but benefit from the gain of the stock as reflected in the price of the option. Please do not be greedy or over-leveraged. Beware of options.
All buy calls/puts must be at least 10 contracts and must also be ATM. Far OTM calls are speculative and 95% chance of loss. You need to be working with underlying symbols that have large open interest and a price range of $20-$50. Your pocket must be deep enough to trade more than 1 or 2 contracts at a time.
So what are we talking about here is day trading breakouts, there are only 2 to 3 hours per trading session, where you can make money easily, quickly, without much effort on an intraday basis. That’s right. The optimum times to day trade breakouts is between 9:50 am and 10:50 am and 2:00 pm – 3:15 pm. This offers a stock enough time to cultivate the range while providing you with enough facts to ascertain which direction it will breakout. Below are some basic rules that will help you identify winning breakout trades during these volatile time periods:
Only trade stocks that have a minimum of 2 dollar price range from the previous days high or low. Remember, the goal here is to day trade breakouts. The greater the recent trading range, the greater your odds are of being in a stock that has room to trend.
Avoid stocks that are up or down more than 5%.
We do watch futures but we really trade the market direction(s) of the day as a short-term trader. Buckle up! dollar up – stocks down or the dollar down – stocks up - hands down on the open!!
If playing the long side, is the Dow, S&P 500, and NASDAQ all in strong up trends? They must be. If playing the short side, the major indices need to be in a strong downtrend. Don't try swim against the current.
The price needs to show a prejudice towards one side or the other. The uptrend signifies a solid bias towards the high and raises the probability of a follow-through if the high is broken.
Volume ought to be high. One thing to make note of with any breakout trading play is the volume should increase on the breakout. The trades within the tape must be increasing in size and quantity as the level is broken. This suggests that the trade possesses the momentum to carry on to your goals without falling back into the opening range.
Exit Technique
To exit, I like to set a hard target of say 1.5% or even more and then take profit. Bulls make money, bears make money, but pigs get slaughtered. You shouldn't be a pig. Keep your profit target small and when you hit it, get out. Look out for the price as it approaches whole numbers. Many stock traders take profits at these crucial psychological levels. These sort of whole numbers and half numbers are $20, $21, and/or $20.50, $21.50 and so forth.
DELTA
SHORT TERM: Where we are looking at holding a position perhaps 90 days or less on average. Because the exit date has already been established for most of these trades you know how long you will be in this trade.
DELTA is the most important factor we analyze in our method of options selection. Delta is the return you can expect for a dollar of change in the underlying stock AT THE CURRENT PRICE RANGE FOR THE STOCK. As the stock increases in price its Delta will also increase. If we pick an option with a Delta of .6, we can expect that the option will go up about 60 cents for the next 1 dollar rise in price of the stock. After that price increase, the Delta of the option would be greater than .6 and if the stock continues to increase in price at some point the option will have a Delta of 1.0 which means it effectively increases on a dollar for dollar basis in parity with the stock.
We want to pick a Delta to match the length of time we believe the option will be in play to allow it to grow. Here are the ranges we look at:
SHORT TERM (30 to 90 days): Delta 50 to 80
VERY SHORT TERM (less than 30 days): Delta of 80 to 90
In Summary
The Opening Range Breakout is one of the most straightforward day trading set-ups to understand. The first hour of the trading day is considered the most volatile. Bears and bulls are battling against each other in the stock market, wanting to show you who is will be the superior group throughout the day. This volatility results in a price-range you are able to trade from. Like all breakout trading set-ups, it is a terrific set-up as it creates a very low risk entry. If there isn't any follow-through on the opening range breakout, you must exit the trade quickly. If you are day trading breakouts, you need things to happen quickly and precisely. You do not have time to wait around for the stock to act appropriately. Remember, there are times you can day trade breakouts throughout the entire day, but more times than others you will either breakeven, or make little money. Also, day trading breakouts should be easy money, not a fight, it is always easier to go with the trend.
Thursday, March 1, 2012

Tuesday, February 28, 2012
SWN - STRADDLE MAR 33 C/P


THE BIG PICTURE: Southwestern Energy has less incentive to spend money on its gas drilling operations this year as the price of natural gas continues to linger around 10-year lows. Just a few years ago, natural gas was one of the pricier sources of energy. But producers have brought up huge amounts of gas from shale deposits, filling the nation's storage facilities nearly to overflowing and pushing down prices.
So companies like Southwestern Energy make less on the open market and hesitate to spend more on producing gas.
THE ANALYSIS: Southwestern Energy dropped its 2012 production forecast to surprisingly low levels. Analyst Coleman said in a note to clients that he had thought the company would produce 577 billion cubic feet during the year. With the lower outlook, he cut his 2012 earnings forecast by 7 percent to $1.23 per share. He rated the company "Market Perform."
SHARE ACTION: Southwestern shares fell $2.45, or nearly 7 percent, to $32.88 in afternoon trading. The stock has ranged between $28.37 and $49.25 in the past 52 weeks.
Subscribe to:
Posts (Atom)