Is a private-equity research firm.
The charts provided here are not meant for investment purpose(s) and only serve as technical examples. Trader Disclosure: See below for our Legal / Disclaimer.

Saturday, December 13, 2008

JPM - Weekly and Daily Charts


The first chart is a Weekly chart; looks likely its finishing up on closing the window left on a gap down to the $20.00 level. Auto Bailout did not pass and I believe there may be more uncertain in the market and the markets always retest the lows on way or another. Indicators are in a downtrend, as you can see in the Daily chart.
The second chart is a Daily chart; as shown it is currently in a downtrend, I believe Fri was a blowoff of the Auto Bailout not passing and a lot of traders did not want to go into the weekend long or short. The WhiteHouse will have some of the earmarked Financial Bailout package money to be used for the Automarker.

Sunday, December 7, 2008

JPM - Running To R1 Level? Can We Break It?


JPM is running to its R1 level of $35 per shr. Can we break it and make a run for the $40 per shr level, it appears that we have a W bottom in place with it clearing and closing above the middle of the W point. As you can see there is heavy R1 Resistance - MA indicators are down to flat on this daily chart.

MA 20 = $35 per shr
MA 50 = $36 per shr
MA 200 = $40 per shr

BAC = Bank of American and MER = Merrill Lynch, shareholder have approved a merger of the two companies, over the weekend and this may help with the financial on Monday Dec 8, 2008. Friday running in the financial sector the Big Boys and Girls were pleased to say the least, as there was a major run up in the Financial Sector. Consolidation within the industry mean money is moving around, who will be next?

Saturday, December 6, 2008

JPM seems to be comming out strong in December. As can see on this one minute chart JPM placed a double bottom pattern, which helped it run from 2:30 EST into the close of the day. Close up on the day for a gain of +2. Charts are for daytrade and scapling at this point in time. All cash or trade in and out days are here to stay. Companies are in the process of cutting and trim for the holidays. So, I would be careful in considering this a Holiday or Christmas rally.

Also, for some reason the options symbols have changed for JPM to JSA. So make sure you go to http://www.cboe.com/ for the current symbols and strike prices for your stock.

Sunday, November 30, 2008


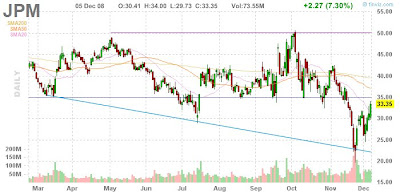
This a screen shot of JP Morgan; the holiday run for the stock has been good. Financials have been suffering of late. However, the automakers have taken most of the pressure/focus off with a 2nd helping of a bailout from the government to Citigroup, 3rds anyone.

I believe JPM is one; if not the most strongest of the financials. Citigroup = C is a poster child for the financials. There is no one too big to fail.

December is a time for selling to write-off the years losses and for the Big Guys to do distributions and make everything look nice. We will see in the next couple of trading weeks.

30.00 JPMLF.X Calls Dec 3.64 C 2,819 V 23,925 OI
32.50 JPMLZ.X Calls Dec 2.04 C 1,695 V 15,902 OI

27.50 JPMXT.X Puts 1.39 C 1,079 V 18,529 OI
30.00 JPMXF.X Puts 2.00 C 2,668 V 61,647 OI

Saturday, November 8, 2008

Trader System

This strategy is originally created and has been changed to adept to the current market direction. This has been tested for trading all Securities, Commodities and Futures. I like the way it define market motion.

It’s quite simple, what you need is 50 SMA, 35 EMA and 20 EMA attached on your 5M Chart. Open position when the angle of the 50 Simple moving average are greater than 20 degrees and the price retrace back into the zone of the 35 Exponential moving average and the 20 Exponential moving average.

Monday, September 29, 2008

Good Example of Avoiding Day Trader Status

Due to an overwhelming request of questions about Day Trader Status I have decided to write this newsletter to look at these issues. Whether you know about it or not, you don't want to accidentally learn about Day Trader Status by a notice from your brokerage firm saying that you are now tagged as a Day Trader!

WHAT IS A DAY TRADER?

A Day Trader is someone who does four intra-day trades in five consecutive trading days. Let me address some terms here to help you understand this better:

Intra-day trade: A trade that is opened and closed in the same trading day (round trip).

Five Consecutive Trading Days: These are calendar days that the market is open, all in a row. For example:

If the market was open on Monday through Friday that would be five consecutive days.

Then we would have Tuesday through Monday for the next five consecutive days (unless Monday was a holiday in which case it would then be Tuesday through Tuesday.

Next, we would have Wednesday through Tuesday, and so on. The key is five trading days in a row.


HOW TO AVOID IT

One of my favorite students, Debi D, taught me to use a calendar to record my intra-day trades. By placing an "X" on the day

you do intra-day trades, (2 X's if you do two, 3 X's if you do 3 in that day) you can avoid accidentally getting to four by

looking at your calendar. Make sure you mark the days the market is closed on your calendar.

WHY DOES IT MATTER?

I thought it mattered a lot, but after my research for this newsletter, it appears there actually are some great benefits

being classified as a "Day Trader" if the $25,000 is not an issue for you. Basically there are two issues at hand:

ISSUE ONE: Your brokerage firm will likely impose the NASD requirements of maintaining at least $25,000 in your trading

account - and you have 5 days to comply. If you have this kind of money there is no issue! However, if you are starting out

with limited funds to trade it could be a big issue! One important note - always ask for one time of forgiveness! Many

students told me they did and the status was removed - so ASK! There may be a way around it, but I am not sure. From my

reading of the requirements, the penalty for not complying is that you are subject to cash only trades, (which are what we

were doing anyway with options)!

There is a really incredible benefit though if you are tagged a Day Trader and maintain the $25,000 minimum value in

your account. You may be eligible for day-trading margin, which is 4 times account buying power. WOW DO I EVER LIKE THIS

ONE!! This buying power may only be used intra-day and may not be held past market close. Orders exceeding Day-Trading Buying

Power will be rejected.

ISSUE TWO: Tax Consequences with the IRS

Actually upon my research into the IRS Publications it does not appear as bad as I thought. A tax firm specializing in trading activity, says:
o They allow a full deduction of all trading losses in the year they occur, thereby circumventing the historical $3,000 net capital loss rule.
o They allow full current expensing of trading expenses without limitation, thereby circumventing the limitation on miscellaneous itemized deductions.
o They enable the active trader to still take advantage of the beneficial long term capital gain rules.

o They enable the active trader to circumvent the restrictive "Wash Sale" rules normally applied to investors, thereby alleviating a huge record-keeping nightmare.

o They allow the active trader to deduct losses on open as well as closed positions.

Continuing on with my IRS research:

You would report your trader's activity as a business on Schedule C of your 1040, possibly allowing all the deductions for your classes and tools, versus a limitation on deduction for passive trading that would have had to be reported on your

Schedule A with a 2% AGI limitation deduction. But here is the sweet deal: you can still elect to report your gain or loss on

Schedule D as a capital gain unless you made the mark-to-market election, (which has you claim the income as ordinary income on Form 4797 instead of Schedule D - see IRS Publication 550 for more information on this). Just to be safe, you better talk to an accountant that specializes in stock market trading. Being a retired accountant, I want to tell you that most accountants will not know how to treat your trading income properly - you need to understand this.

The proper classification of your investment activities is important to determine how income and expenses are to be reported.

Traders that buy and sell securities frequently can report their purchases and sales result in capital gain and loss, and their deductible expenses are trade or business expenses.

Happy Trading!

Darlene Powell with Better Trades

Sunday, September 28, 2008

My Tools

These are my current tools I use in my trading.

1. I pefer to use two Candlestick charts with the 1 min and 5 min.

2. Technical indicators are the MA 8,20,35, the RSI at 2 and a stoch at 5,3.

PDT - Pattern Day Trader

For some of us that do not have the $25k to trade everyday. We are only allowed to complete 3 trade out of a 5 day week. If you trade more than this your account will be labeled as a PDT. A day trade consists of opening and closing the same position the same day. More than three such in five days constitutes pattern day trading: i.e., four day trades in five days. So, if on Monday you place a buy order for, say, AAPL at 9AM, another buy order for AAPL at 10AM, and another buy order for AAPL at 11AM, then sell the whole bunch at noon, you have three day trades. So, if you make another day trade on Friday, you will be flagged as a pattern day trader. Likewise, if you do one day trade on Monday, one on Tuesday, and one on Wednesday, then do another on Friday, you will be flagged as a pattern day trader.

As a practical matter, daytrading in a cash account is difficult to accomplish. This is due to the application of two related rules known as "good faith" and "freeriding" requirements. These rules are not part of the PDT rules and stand on their own. In summary, vastly oversimplified, these rules require that you have all the money you need to settle trades in a cash account available even if the stock is sold before settlement. Moreover, and herein lies the rub, the good faith issue arises when the stock is sold prior to settlement even if the customer funds the trade subsequent to sale but prior to settlement. The freeriding provisions kick in whenever funds are not available on the settlement date. There are numerous discussions of their application on the internet. Reading some of the examples that are provided will likely cause a person to realize that compliance might be more trouble than it is worth.